
Your API is slow. But how slow, exactly? You need numbers. Real metrics that tell you what's actually broken and where to fix it.
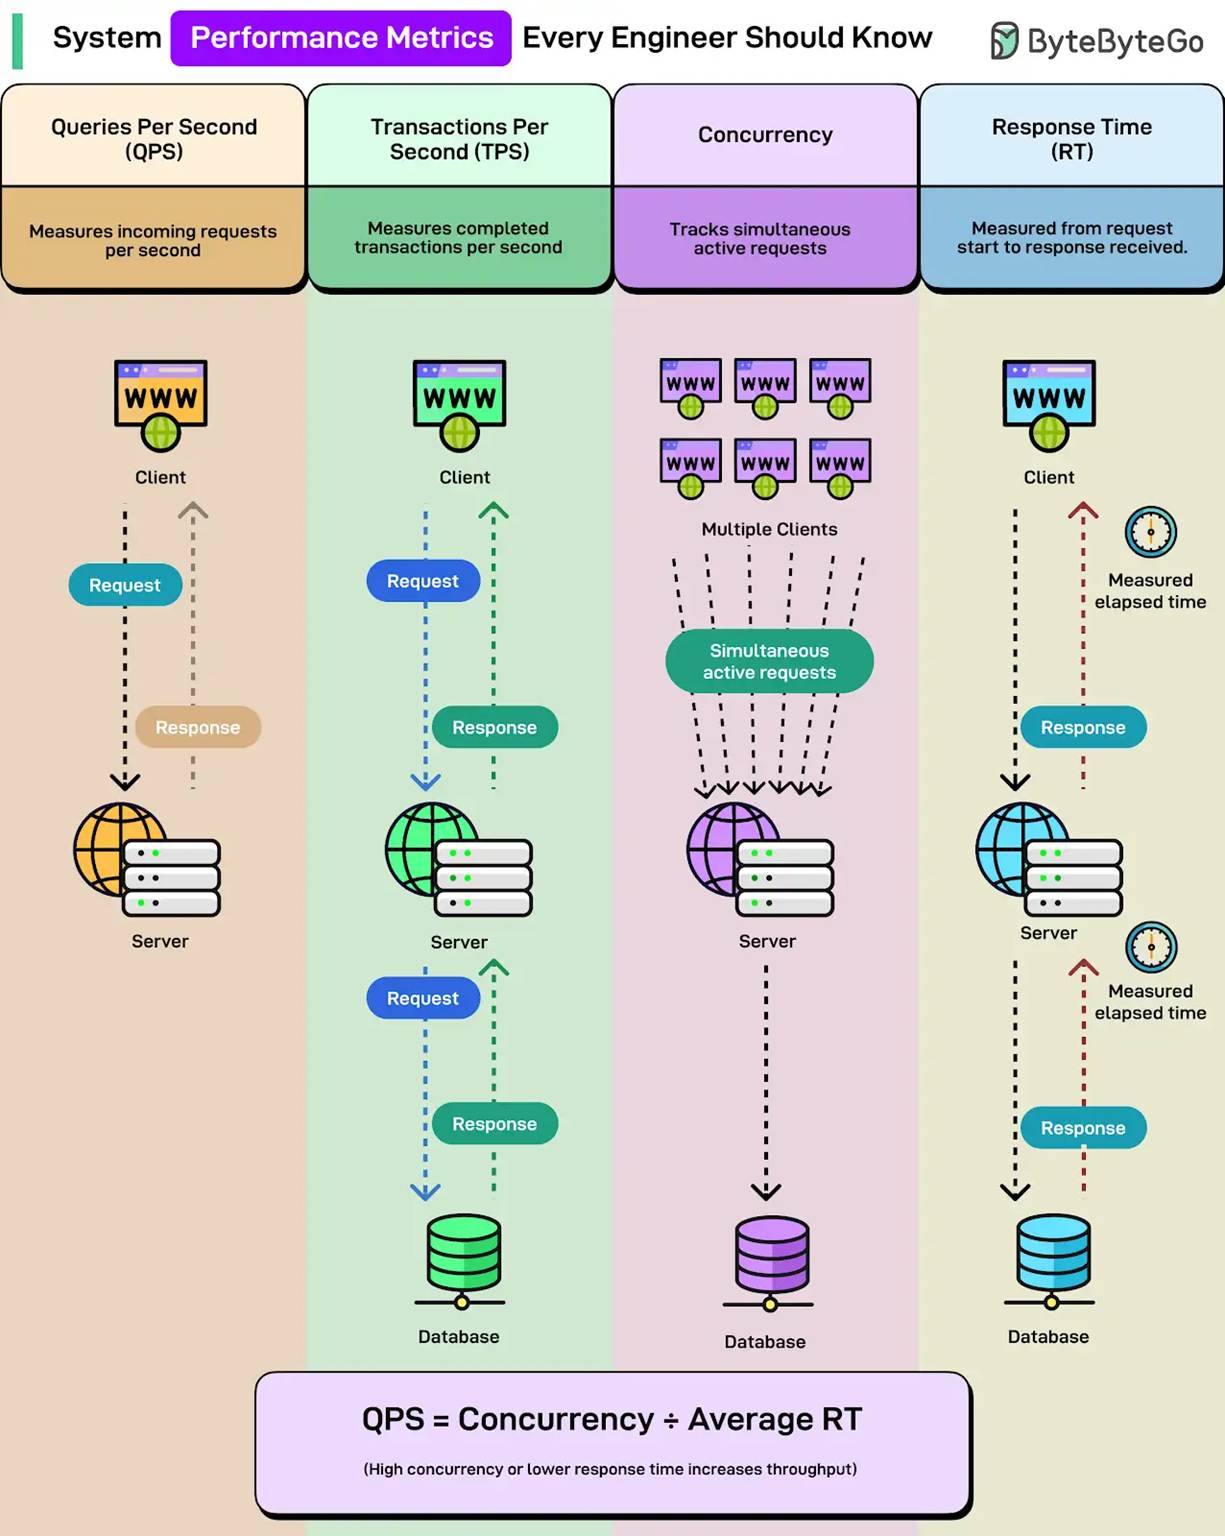
Here are the four core metrics every engineer should know when analyzing system performance:
- Queries Per Second (QPS): How many incoming requests your system handles per second. Your server gets 1,000 requests in one second? That's 1,000 QPS. Sounds straightforward until you realize most systems can't sustain their peak QPS for long without things starting to break.
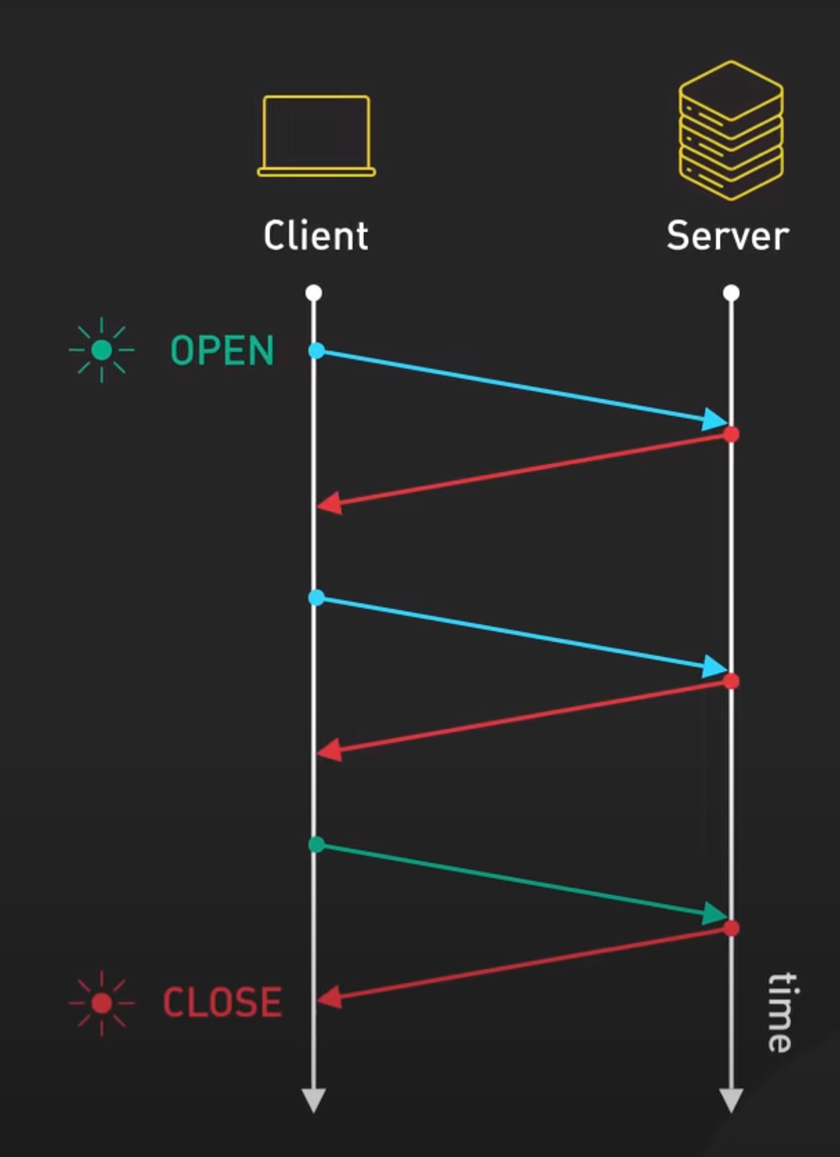
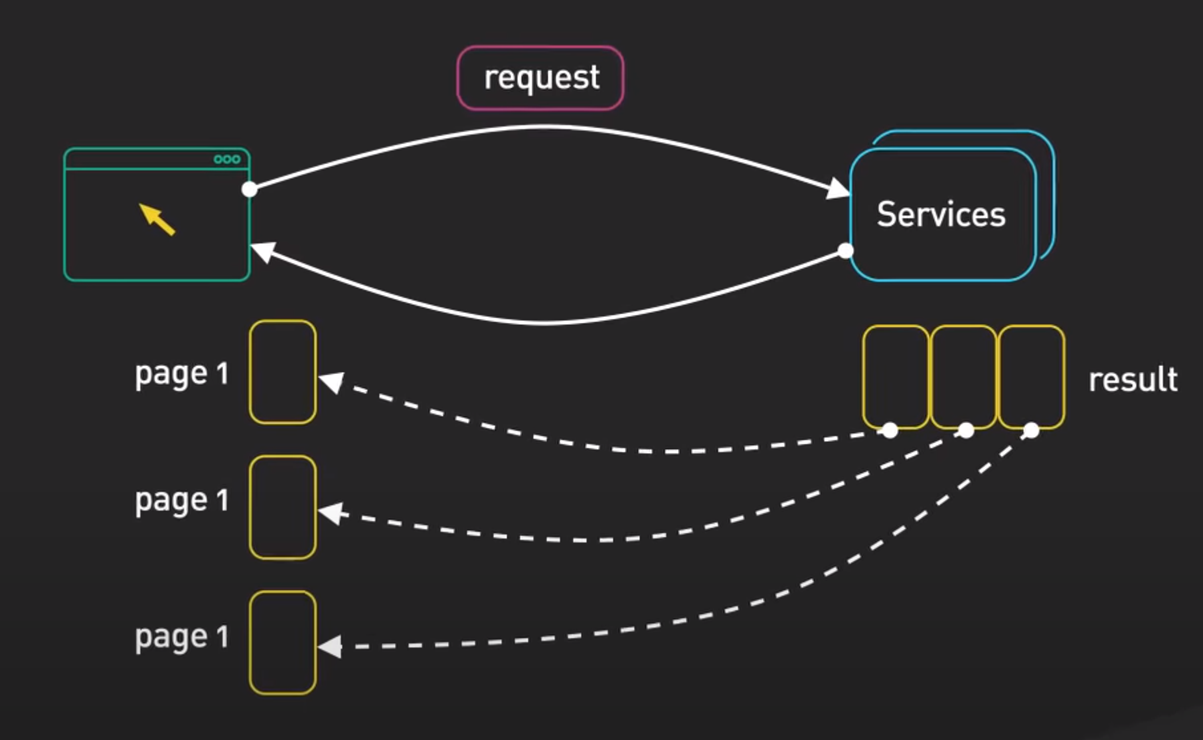
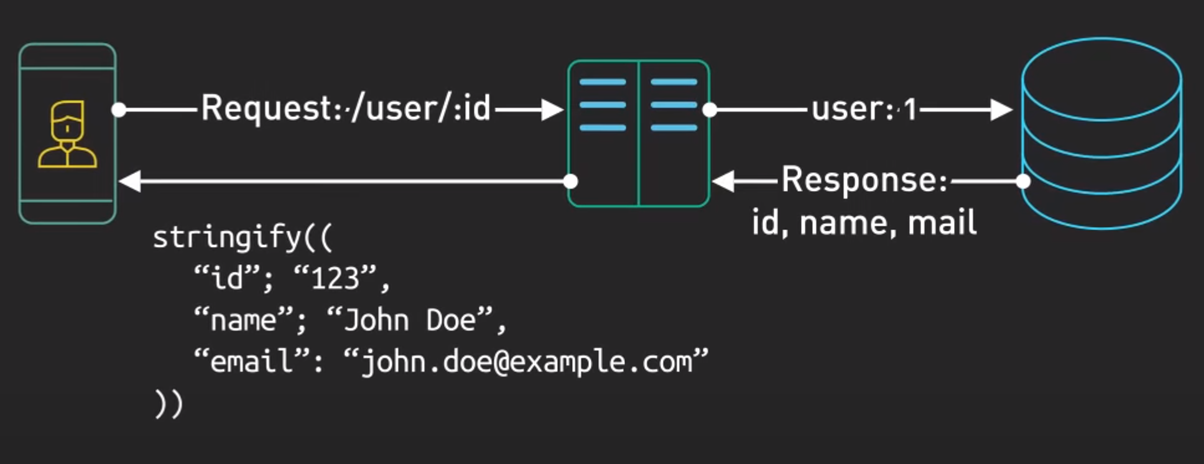
- Transactions Per Second (TPS): How many completed transactions your system processes per second. A transaction includes the full round trip, i.e., the request goes out, hits the database, and comes back with a response.
TPS tells you about actual work completed, not just requests received. This is what your business cares about.
- Concurrency: How many simultaneous active requests your system is handling at any given moment. You could have 100 requests per second, but if each takes 5 seconds to complete, you're actually handling 500 concurrent requests at once.
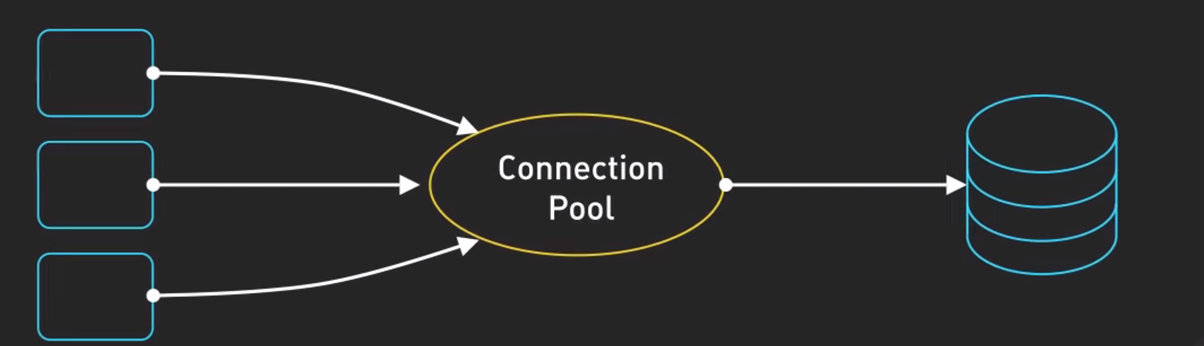
High concurrency means you need more resources, better connection pooling, and smarter thread management.
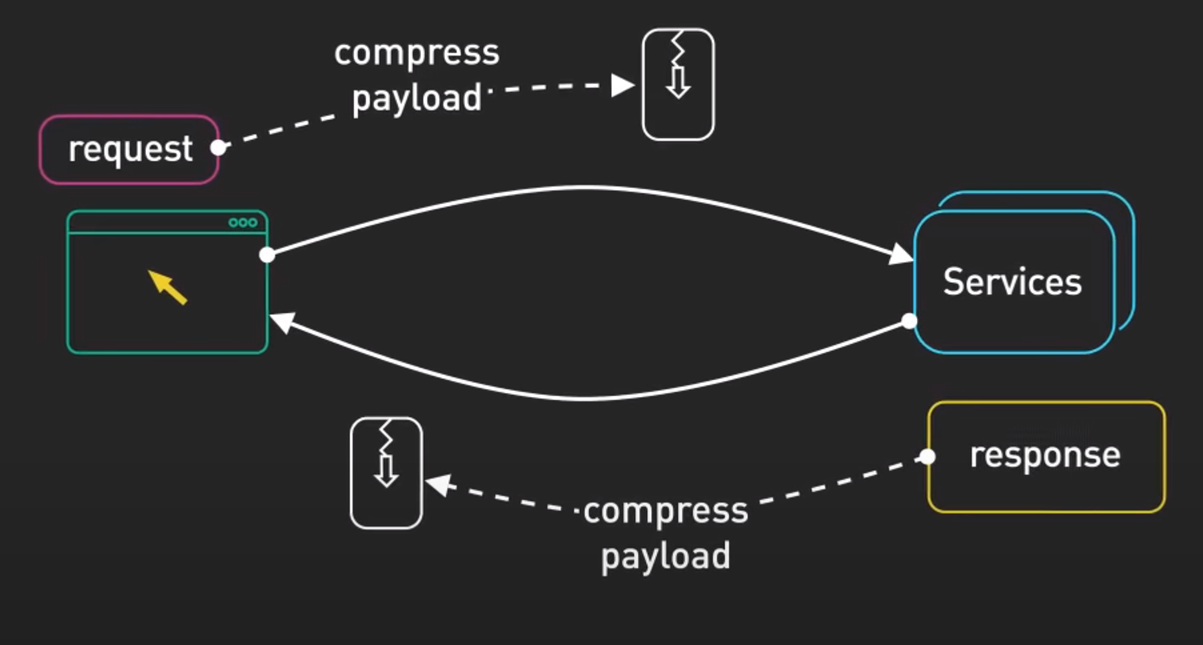
- Response Time (RT): The elapsed time from when a request starts until the response is received. Measured at both the client level and server level.
A simple relationship ties them all together: QPS = Concurrency ÷ Average Response Time
More concurrency or lower response time = higher throughput.
Over to you: When you analyze performance, which metric do you look at first, QPS, TPS, or Response Time?
--
We just launched the all-in-one tech interview prep platform, covering coding, system design, OOD, and machine learning.